

A financial model investors can use connects business assumptions to cash needs, risks, and potential returns. To understand how to build a financial model for investors, start with a clear forecast, make cost and depreciation assumptions visible, and test how the outlook changes across different scenarios.
It’s natural to focus on revenue and growth, but investors also need to see how those forecasts translate into profit and cash flow. A model is more useful when its assumptions are easy to follow and its downside case is as clear as its upside.
This guide walks through practical steps: choosing a model structure, linking financial statements, setting cost and capital expenditure assumptions, and building base, upside, and downside scenarios. You’ll also learn how to use the results to explain funding needs and support investment decisions, rather than treating the spreadsheet as a set of disconnected projections.
Key Takeaways
- Separate operating costs, capital expenditure and depreciation assumptions so investors can see how each affects projected performance.
- Link the income statement, balance sheet and cash flow statement to show how business decisions flow through the model.
- Use base, upside and downside scenarios to reveal how changes in key assumptions could affect results.
- Connect funding needs to operating plans, cash flow and upcoming business milestones.
- Clear bookkeeping and financial records can support stronger assumptions and more useful investor discussions.
Cost, capital expenditure, and depreciation assumptions
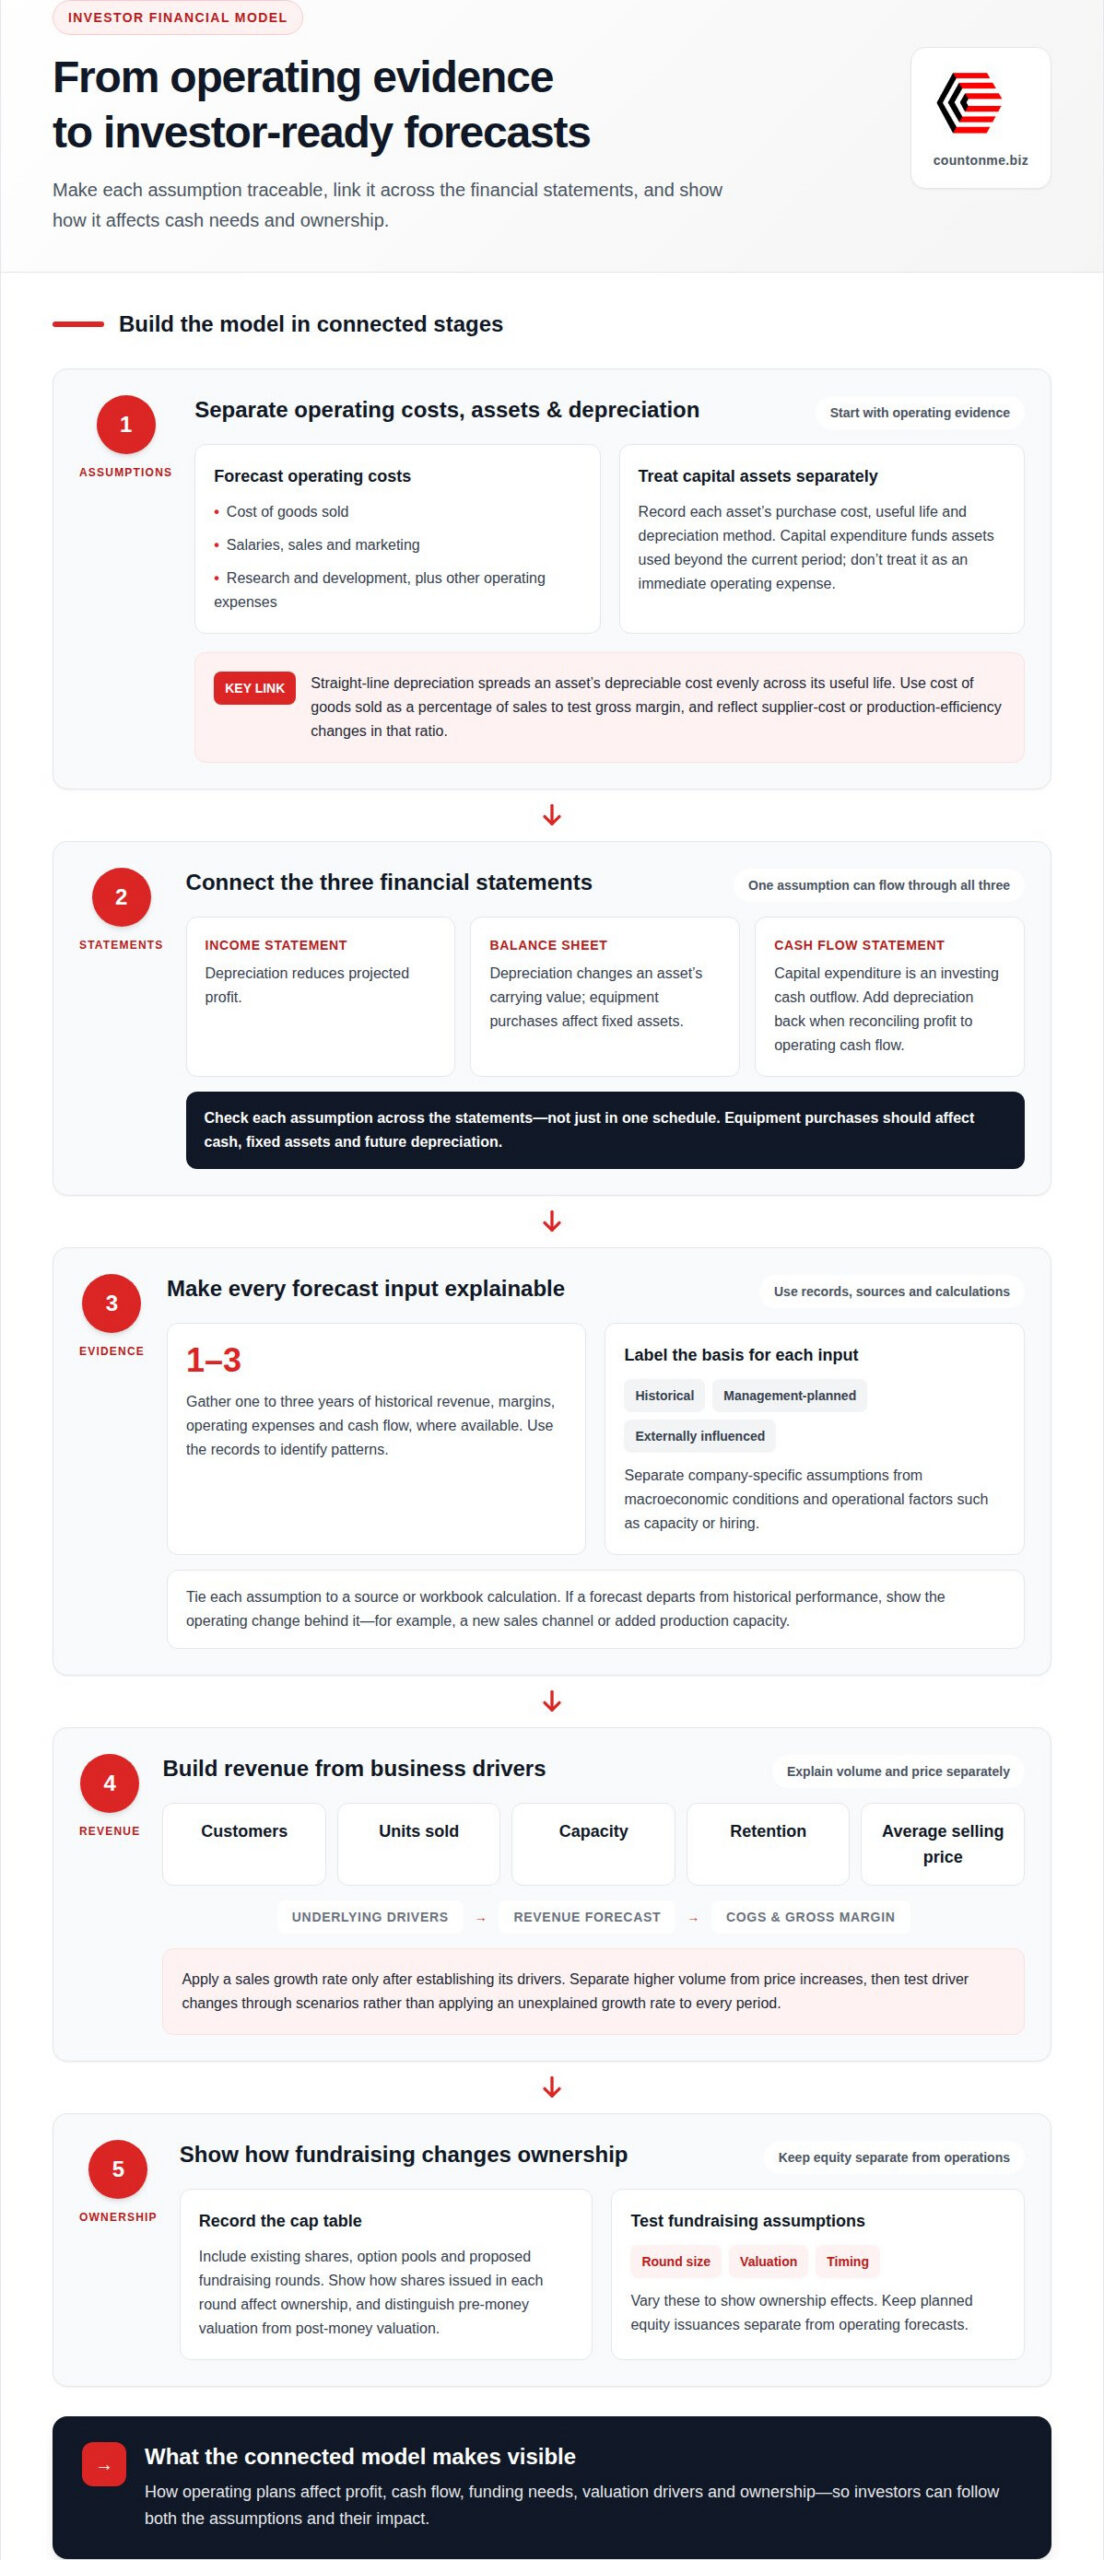
Build assumptions from operating evidence, then show how each affects revenue, costs, cash flow, and valuation. A useful approach to how to build a financial model for investors is to make every forecast driver traceable to a business activity.
-
Set Cost and Depreciation Assumptions
Separate recurring operating costs from capital expenditure, which funds assets used beyond the current period. Forecast cost of goods sold, salaries, sales and marketing, research and development, and other operating expenses. For each asset, record its purchase cost, useful life, and depreciation method. Straight-line depreciation spreads an asset’s depreciable cost evenly across its useful life. Keep these assumptions visible, and don’t treat a capital purchase as an immediate operating expense.
Use cost of goods sold as a percentage of sales to test gross margin. If supplier costs or production efficiency change, reflect the effect in that ratio rather than applying an unexplained margin adjustment.
-
Link Assumptions to Financial Statements
Connect operating assumptions to the income statement, balance sheet, and cash flow statement. Depreciation reduces profit on the income statement and changes an asset’s carrying value on the balance sheet. Capital expenditure appears as an investing cash outflow, while depreciation is added back when reconciling profit to operating cash flow.
Check how each assumption flows through the statements. For example, increased equipment purchases should affect cash, fixed assets, and future depreciation, not just one schedule. This structure helps investors follow funding impacts and valuation drivers.
- Gather one to three years of historical revenue, margins, operating expenses, and cash flow where available. Use those records to identify patterns, then label each forecast input as historical, management-planned, or externally influenced. Separate company-specific assumptions from macroeconomic conditions and operational factors such as capacity or hiring. This helps investors see which drivers management can influence and which belong in scenarios.
Tie each assumption to a source or calculation in the workbook. If a forecast departs from historical performance, show the operating change behind it, such as a new sales channel or added production capacity.
- Build revenue from drivers investors can understand: customer numbers, units sold, capacity, retention, and average selling price. Apply a sales growth rate only after establishing its underlying drivers. Separate higher volume from price increases, so the model shows which assumption expands revenue and which may affect demand. Then connect revenue to cost of goods sold and gross margin.
Test changes in these drivers through scenarios instead of applying an unexplained growth rate to every period. This makes the relationship between commercial execution and cash needs clearer.
- Model dilution with a cap table that records existing shares, option pools, and proposed fundraising rounds. Show how shares issued in each round affect ownership, and distinguish pre-money valuation from post-money valuation. Investors scrutinise revenue growth, gross margin, operating expenses, cash generation, funding needs, and the evidence behind projected returns. The same discipline underpins how to build a financial model for investors: keep assumptions traceable and metrics consistent.
For fundraising scenarios, vary round size, valuation, and timing to show ownership effects. Keep planned equity issuances separate from operating forecasts, and make each key assumption easy to follow.
What is Financial Modeling, and Why Does It Matter?
Financial modelling turns business assumptions into connected statements, cash flow projections, and decision-ready outputs. For investors, it clarifies how operating plans could affect funding needs, value, and risk.
-
Develop Financial Statements
Build the income statement, balance sheet, and cash flow statement in Excel or Google Sheets, using a separate worksheet for each. Start with revenue and expenses, then connect operating results to assets, liabilities, and cash movements. Use formulas rather than re-entering totals manually, so a changed input updates each relevant output. Check that statements use consistent periods and that the balance sheet balances.
These statements form the foundation for other models. A discounted cash flow model uses forecast cash flows to estimate present value; an M&A model assesses the pro forma effect of an acquisition.
-
Build a Three-Statement Model
Link the income statement, balance sheet, and cash flow statement so an assumption in one schedule flows through the others. For example, higher sales can increase profit but also raise accounts receivable when customers haven’t paid. Reflect that working-capital movement in cash flow instead of treating profit as available cash.
Use the linked statements to project operating cash flow and closing cash. Check that changes in debt, assets, and retained earnings carry through consistently.
- Forecast revenue from commercial drivers, then project each expense from its relevant driver. For example, connect sales volume and average selling price to revenue, and link supplier or staffing costs to expected activity. Model working capital through collection timing, inventory needs, and supplier payment timing. This shows why growth can consume cash even when the income statement reports a profit.
To calculate runway, compare available cash with the rate at which the business uses cash. Project future cash balances using operating cash flow, working-capital changes, capital expenditure, and financing. The funding need follows from the cash shortfall and the operating milestones the planned capital must support.
- Choose a model structure that matches the decision. A three-statement model provides an operating foundation; a DCF model focuses on the present value of future cash flows. An investment model can assess expected returns, while an M&A model evaluates how a merger or acquisition may affect the combined business. Don’t force a transaction question into a model built for another purpose.
For a startup, bottom-up forecasting connects near-term results to customers, capacity, and sales activity. Longer-term projections can take a broader view of market opportunity and growth. Keep the forecast horizon suited to the business plan and investor decision.
- Present outputs investors can trace back to assumptions: revenue, expenses, cash flow, working capital, and funding needs. Use clear labels and consistent formulas, and summarise the main drivers rather than hiding them in spreadsheet tabs. If you’re building a startup forecast alongside core finance processes, the Start-Up Package may be a relevant next step.
Building base, upside and downside scenarios
Build at least three cases from the same operating model: base, upside, and downside. Scenario analysis shows how stronger execution or slower growth could change profit, cash flow, and investor returns.
- Set the base case using the operating plan and evidence behind its key drivers. Carry forward the revenue, cost, and capital assumptions already built into the forecast, and distinguish planned changes from historical patterns. The base case should be a reasoned central outlook, not an automatic midpoint between best and worst outcomes. Investors can then see how the corporate plan translates into projected income and cash needs.
- Create an upside case by changing specific drivers management can influence, such as customer acquisition, retention, sales volume, or operating efficiency. Then build a downside case around slower growth, weaker margins, or delayed execution. Change the underlying inputs, not just the final profit figure, so each scenario explains how different conditions affect projections and cash availability.
- Keep the three cases comparable by changing a limited set of assumptions at a time. An illustrative model varies growth across 25-45%, EBITDA margins across 18-24%, and exit multiples across 5.5-8.5x. These ranges describe that example, not a benchmark for every Singapore business. Label the inputs clearly and show how each change affects income, profit, and investor returns.
- Add sensitivity analysis to isolate the effect of one or two important drivers. For example, test how different growth rates and exit multiples change projected returns while holding other inputs steady. The illustrative model includes an IRR sensitivity table across 25 combinations. This view helps investors identify which assumptions carry the most weight, rather than relying on a single forecast output.
- Run sanity checks before presenting the scenarios. Compare forecast growth and margins with historical performance, then explain any material change with a specific operating reason. Confirm that the downside case flows through the linked statements and reflects weaker cash generation, not only lower accounting profit. A scenario-planning model can use an existing three-statement model, keeping calculations consistent across cases.
- Summarise the results in a compact comparison of key metrics: revenue, EBITDA margin, cash needs, and returns. One illustrative investment model reports bear-case returns of 2.2x and a 17% IRR, base-case returns of 3.0x and a 25% IRR, and bull-case returns of 4.1x and a 33% IRR. Treat these as example outputs, then explain which operating changes produce each result.
Financial modelling and investment decision-making
Use the model to connect historical performance with expected results, funding needs, and the investment decision. Investors need to understand not only projected growth, but also the evidence and assumptions behind it.
- Start with the decision the model must support, such as fundraising, business valuation, or an acquisition. Then organise relevant sources, including historical financial statements, operating records, and the commercial assumptions behind forecasts. Reviewing one to three years of past performance can help show whether expected revenue, margins, and cash generation follow established patterns or represent a material change.
Make each major forecast traceable to its source or calculation. This gives investors a clearer view of the company’s current position, direction, and funding needs.
- Translate the operating plan into a funding requirement. Include expected operating cash flows, working capital, capital expenditure, growth initiatives, existing cash, and a liquidity buffer. A company can report EBITDA profitability while still using cash to fund receivables, repay debt, or invest in assets. Show how these movements affect the ability to reach milestones before further capital may be required.
Separate a planned equity raise from operating performance. This helps investors assess whether the business can execute its plan and how much capital supports that execution.
- Connect projected cash flows to valuation using a method suited to the investment question. A discounted cash flow model discounts expected future cash flows to present value using the company’s weighted average cost of capital. Comparable-company analysis offers another perspective, while an acquisition model examines a transaction’s combined financial impact. Explain the chosen method and its main assumptions instead of presenting valuation as a single, unexplained answer.
Keep growth projections distinct from value already created. Investors can then assess the evidence supporting future performance separately from the valuation assigned to it.
- Show how a proposed investment changes ownership. Pre-money valuation represents the company’s value before new capital; post-money valuation generally includes that investment. Present the proposed equity issuance alongside existing ownership and the operating plan, so investors can understand how funding affects ownership and the company’s capacity to pursue growth.
Use the model to make trade-offs visible. A higher funding target may support more milestones, while a smaller raise may require a different pace or plan.
- Prepare an investor-facing summary that connects historical results, expected growth, cash generation, risks, and funding needs. Keep key assumptions visible in the financial statements, and explain material differences between historical performance and projections. If returns are part of the decision, the National Environment Agency describes a minimum attractive rate of return as a hurdle: a project is undertaken when its IRR exceeds that rate.
Use the summary to focus discussion on the assumptions that matter most to the decision, rather than spreadsheet mechanics alone.
Count On Me
Count On Me can help strengthen the financial information behind investor discussions. Reliable bookkeeping and cloud accounting records give forecasts a clearer foundation, while on-demand CFO support can help interpret cash flow, funding needs, and the assumptions driving your model. This support is useful when you’re preparing to fundraise, updating projections, or finding it difficult to connect day-to-day financial results with strategic decisions. Tax compliance and payroll management can also help organise business finances as your company grows. The next step is a conversation about the financial questions you need to answer and the support that fits those needs.
Make Your Model Part of the Next Decision
A financial model is most useful when it stays connected to the decisions your business faces. As results come in, compare them with the assumptions behind the plan and use the differences to refine future choices. That turns the model into a working management tool, not just a document prepared for a fundraising conversation.
Knowing how to build a financial model for investors also means being ready to explain what could change the outlook. Keep a clear record of why key assumptions shift, which milestones depend on them, and how those changes affect your next strategic move. A thoughtful update can help you approach investor conversations with a more grounded view of the business.
You don’t need every answer before taking the next step. Start with the decision in front of you, then strengthen the model as your information and priorities develop.
Your next financial decision can begin with a clearer view of what matters. Move forward with confidence and keep learning from the numbers.
Frequently Asked Questions
What should an investor-ready financial model include?
Include linked financial statements, clearly documented assumptions, forecast outputs, and a concise investor summary. Add supporting schedules for key drivers, such as revenue, operating expenses, capital expenditure, and financing. A cover or summary tab can state the model’s purpose, reporting currency, forecast period, and version date. Keep definitions and source notes close to relevant inputs, so readers can understand each figure without searching through the workbook.
What historical financial statements and operating data do investors expect?
Provide historical income statements, balance sheets, and cash flow statements, supported by operating records that explain performance. Useful details can include revenue by product or customer group, sales pipeline, headcount, customer retention, and payment timing. Choose data that fits the company’s business model. For example, a subscription business can show renewals and cancellations, while a project business can connect revenue to signed work and delivery progress.
How to create base, upside, and downside financial scenarios?
Build each case from the same model, then change a defined set of assumptions to reflect different operating conditions. For instance, an upside case might pair stronger customer retention with improved sales conversion, while a downside case reflects delays and weaker demand. Keep each case internally consistent, and label the assumptions that distinguish it. This makes the comparison useful for decisions, rather than a set of unrelated spreadsheet outputs.
Which valuation methods do investors use, such as DCF and comparable companies?
Investors may use discounted cash flow analysis, comparable-company analysis, or transaction comparisons, depending on the business and decision. DCF derives value from forecast cash flows and a discount rate; comparables use valuation measures from similar companies. The practical question is whether the chosen method fits the company’s stage, business model, and available evidence. A useful analysis explains why its reference companies or cash-flow assumptions are relevant.
What are common financial modeling mistakes and risks?
Common risks include hard-coded outputs, inconsistent time periods, stale assumptions, and formulas that don’t update when inputs change. Mixed currencies or units can also distort results, especially when data from different systems enters one workbook. Add clear input labels, consistent formatting, and formula checks. Review the model after changing a key assumption, and trace unexpected movements through the schedules before sharing it with investors.